
.png?width=3251&height=1107&name=NP_ByGS_ColorLogo%20(1).png "Northpass By Gainsight logo")

Numbers rule the universe.
Pythagoras said it, and so do we.
Numbers should rule your learning program, too, which is why we’re pumped to introduce a new analytics suite inside Northpass.
Now, 3 all-new reports are live — Course Popularity, Course Completions and Learner Activity Ranking — and ready to deliver in-depth insights that help you bring impactful learning experiences to your customers, workforce or partners.
P.S.: We also enhanced 4 legacy reports and redesigned the Dashboard to create a unified experience. Now, it’s possible to find the reports you need without exhausting your scrolling finger.
Keep reading for a closer look at what you can expect from the upgrade. 👇
Comprehensive & Personalized Data At Your Fingertips
The new analytics engine gives you access to more comprehensive data and insights than ever.
And the best part? These data and insights are easy to access and understand — no digging required — so that you can quickly get your hands on the pressing details you need to level up your academy.
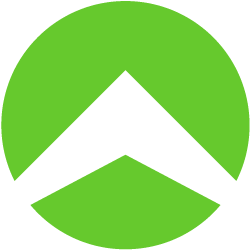
For example, you could use one of the new reports, Course Popularity, to get a glimpse into what’s working — insights you can apply to other courses and activities to generate engagement.
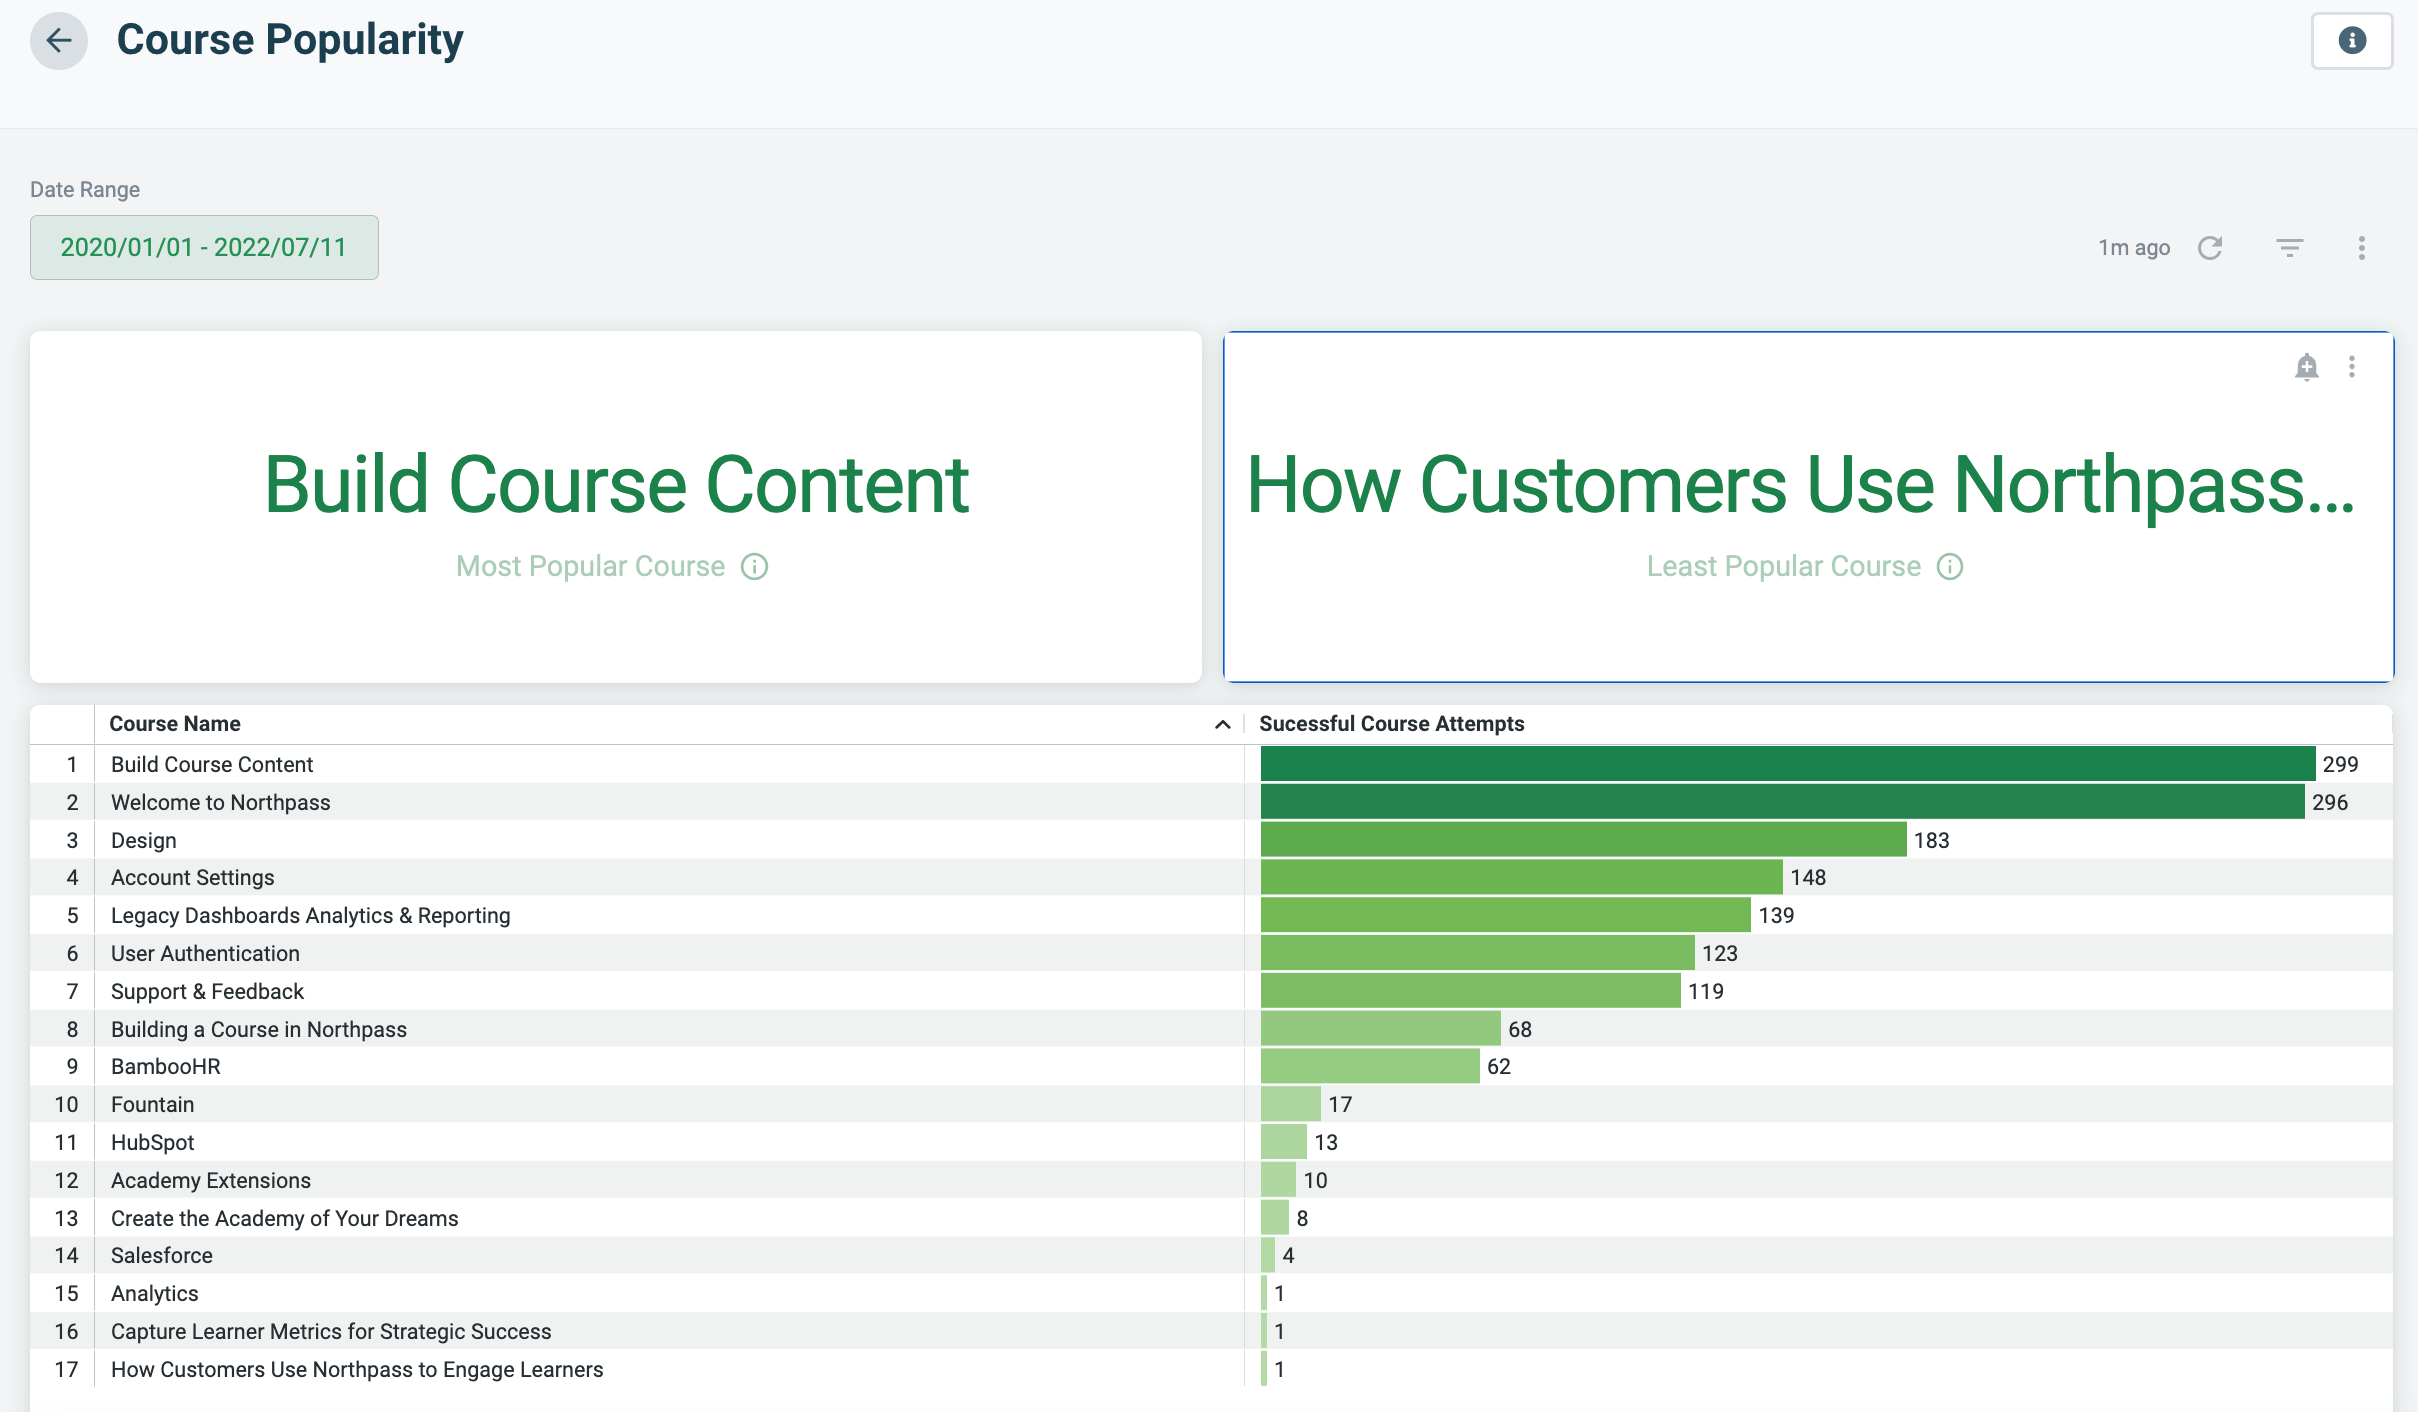
Similarly, you could use the Learner Activity Rankings report to put a spotlight on your superstars while calling attention to those who may need a bit of help.
You can even segment the data using your custom properties to ensure you see the insights that make sense for you and your learners.
So, for example, if you’re using custom properties to automatically send customers courses based on the industry they’re in, you can now pull reports by “industry” as well, allowing you to easily see insights based on your unique learning program.
Bring Your Data to Life
What good are numbers if they’re hard to understand?
Answer: Not good.
That’s why this upgrade also brings our analytics suite to life with pre-built, visual data. So, not only is the data you need at your fingertips but it’s presented in a simple and straightforward way — no data science degree necessary. You can think of the analytics suite as your one-stop shop to turn complex learning data into digestible nuggets you can use to improve engagement, knowledge retention, completion rates and more.
For you, this means more bottom-line-boosting results internal stakeholders will love, like better retention, more satisfaction and greater lifetime value (LTV).
-Jul-13-2022-04-02-01-13-PM.png?width=830&name=image%20(1)-Jul-13-2022-04-02-01-13-PM.png)
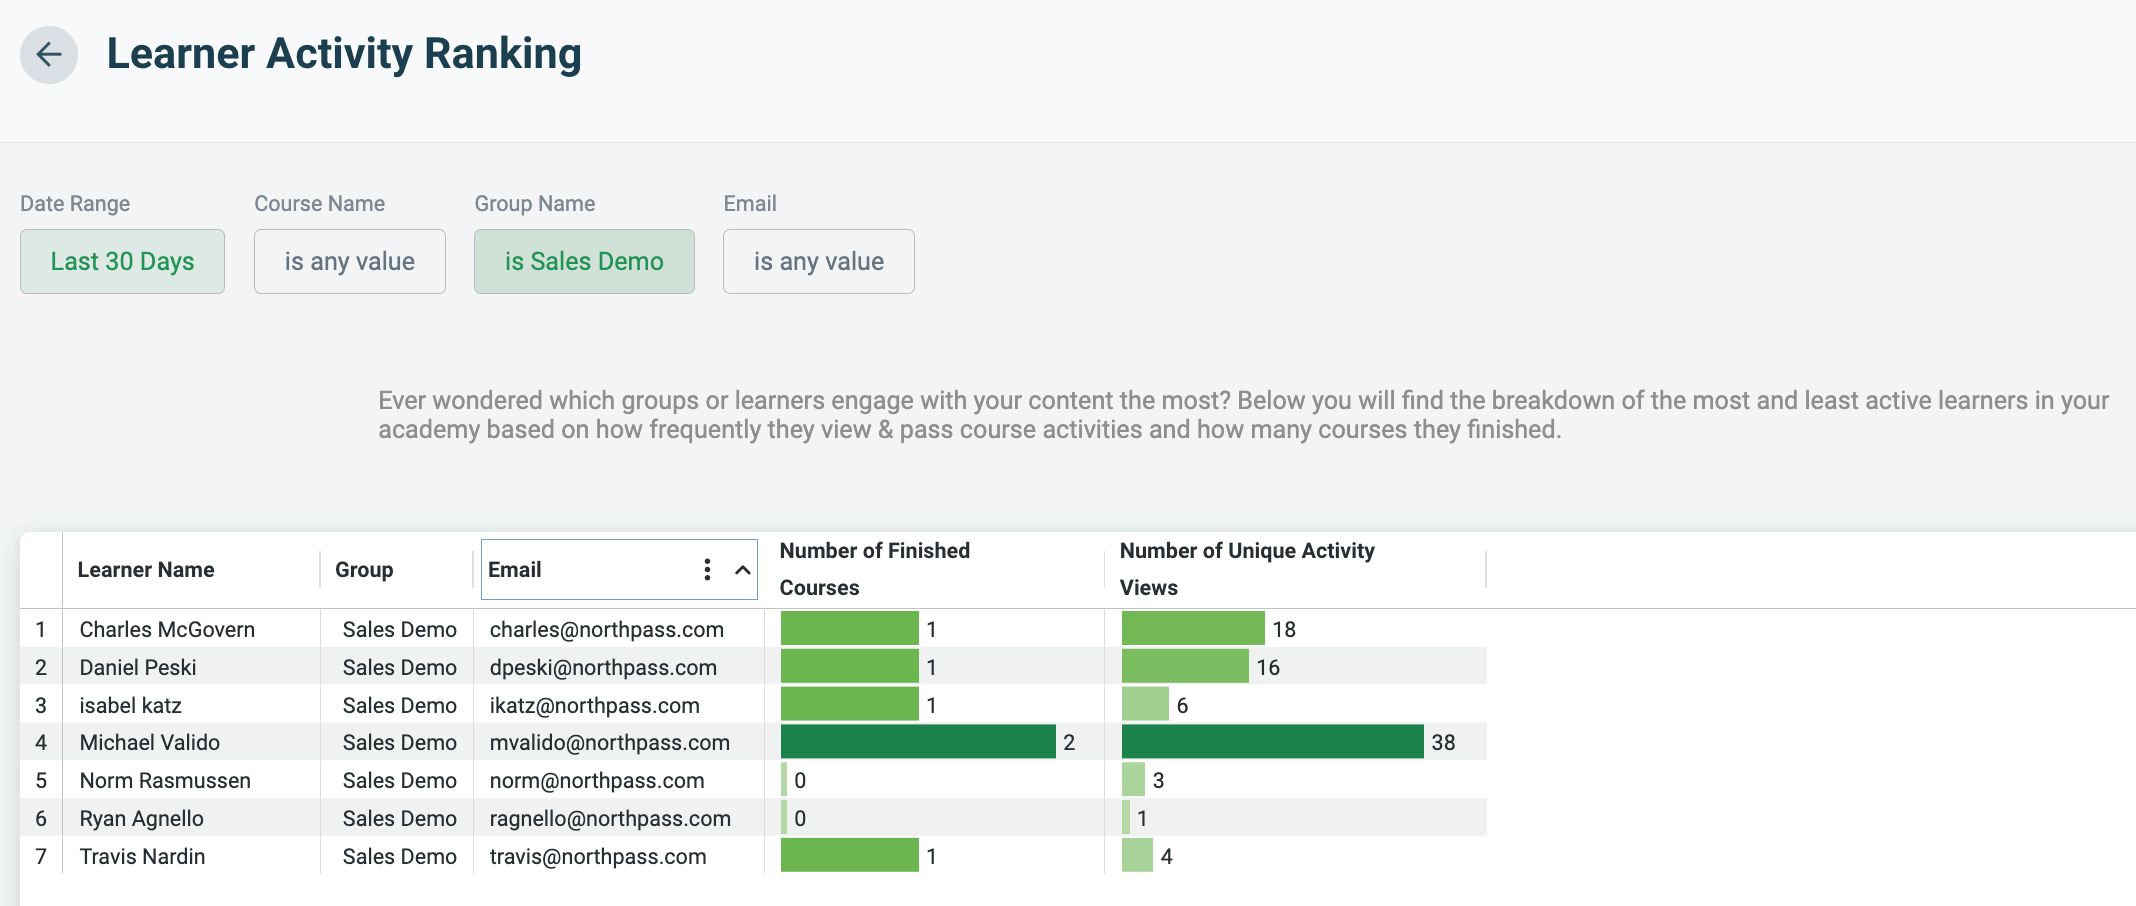
In addition to the new design, you can filter the data so that the report answers your most pressing questions. From there, you can quickly make changes without disrupting the learning experience — changes like reworking a course based on performance from a subset of your customers.
Your Data, Your Way
It’s your academy, so the data you see should reflect that.
That’s why our new analytics suite offers added flexibility so that you can tailor the data and reports in a way that aligns with your needs.
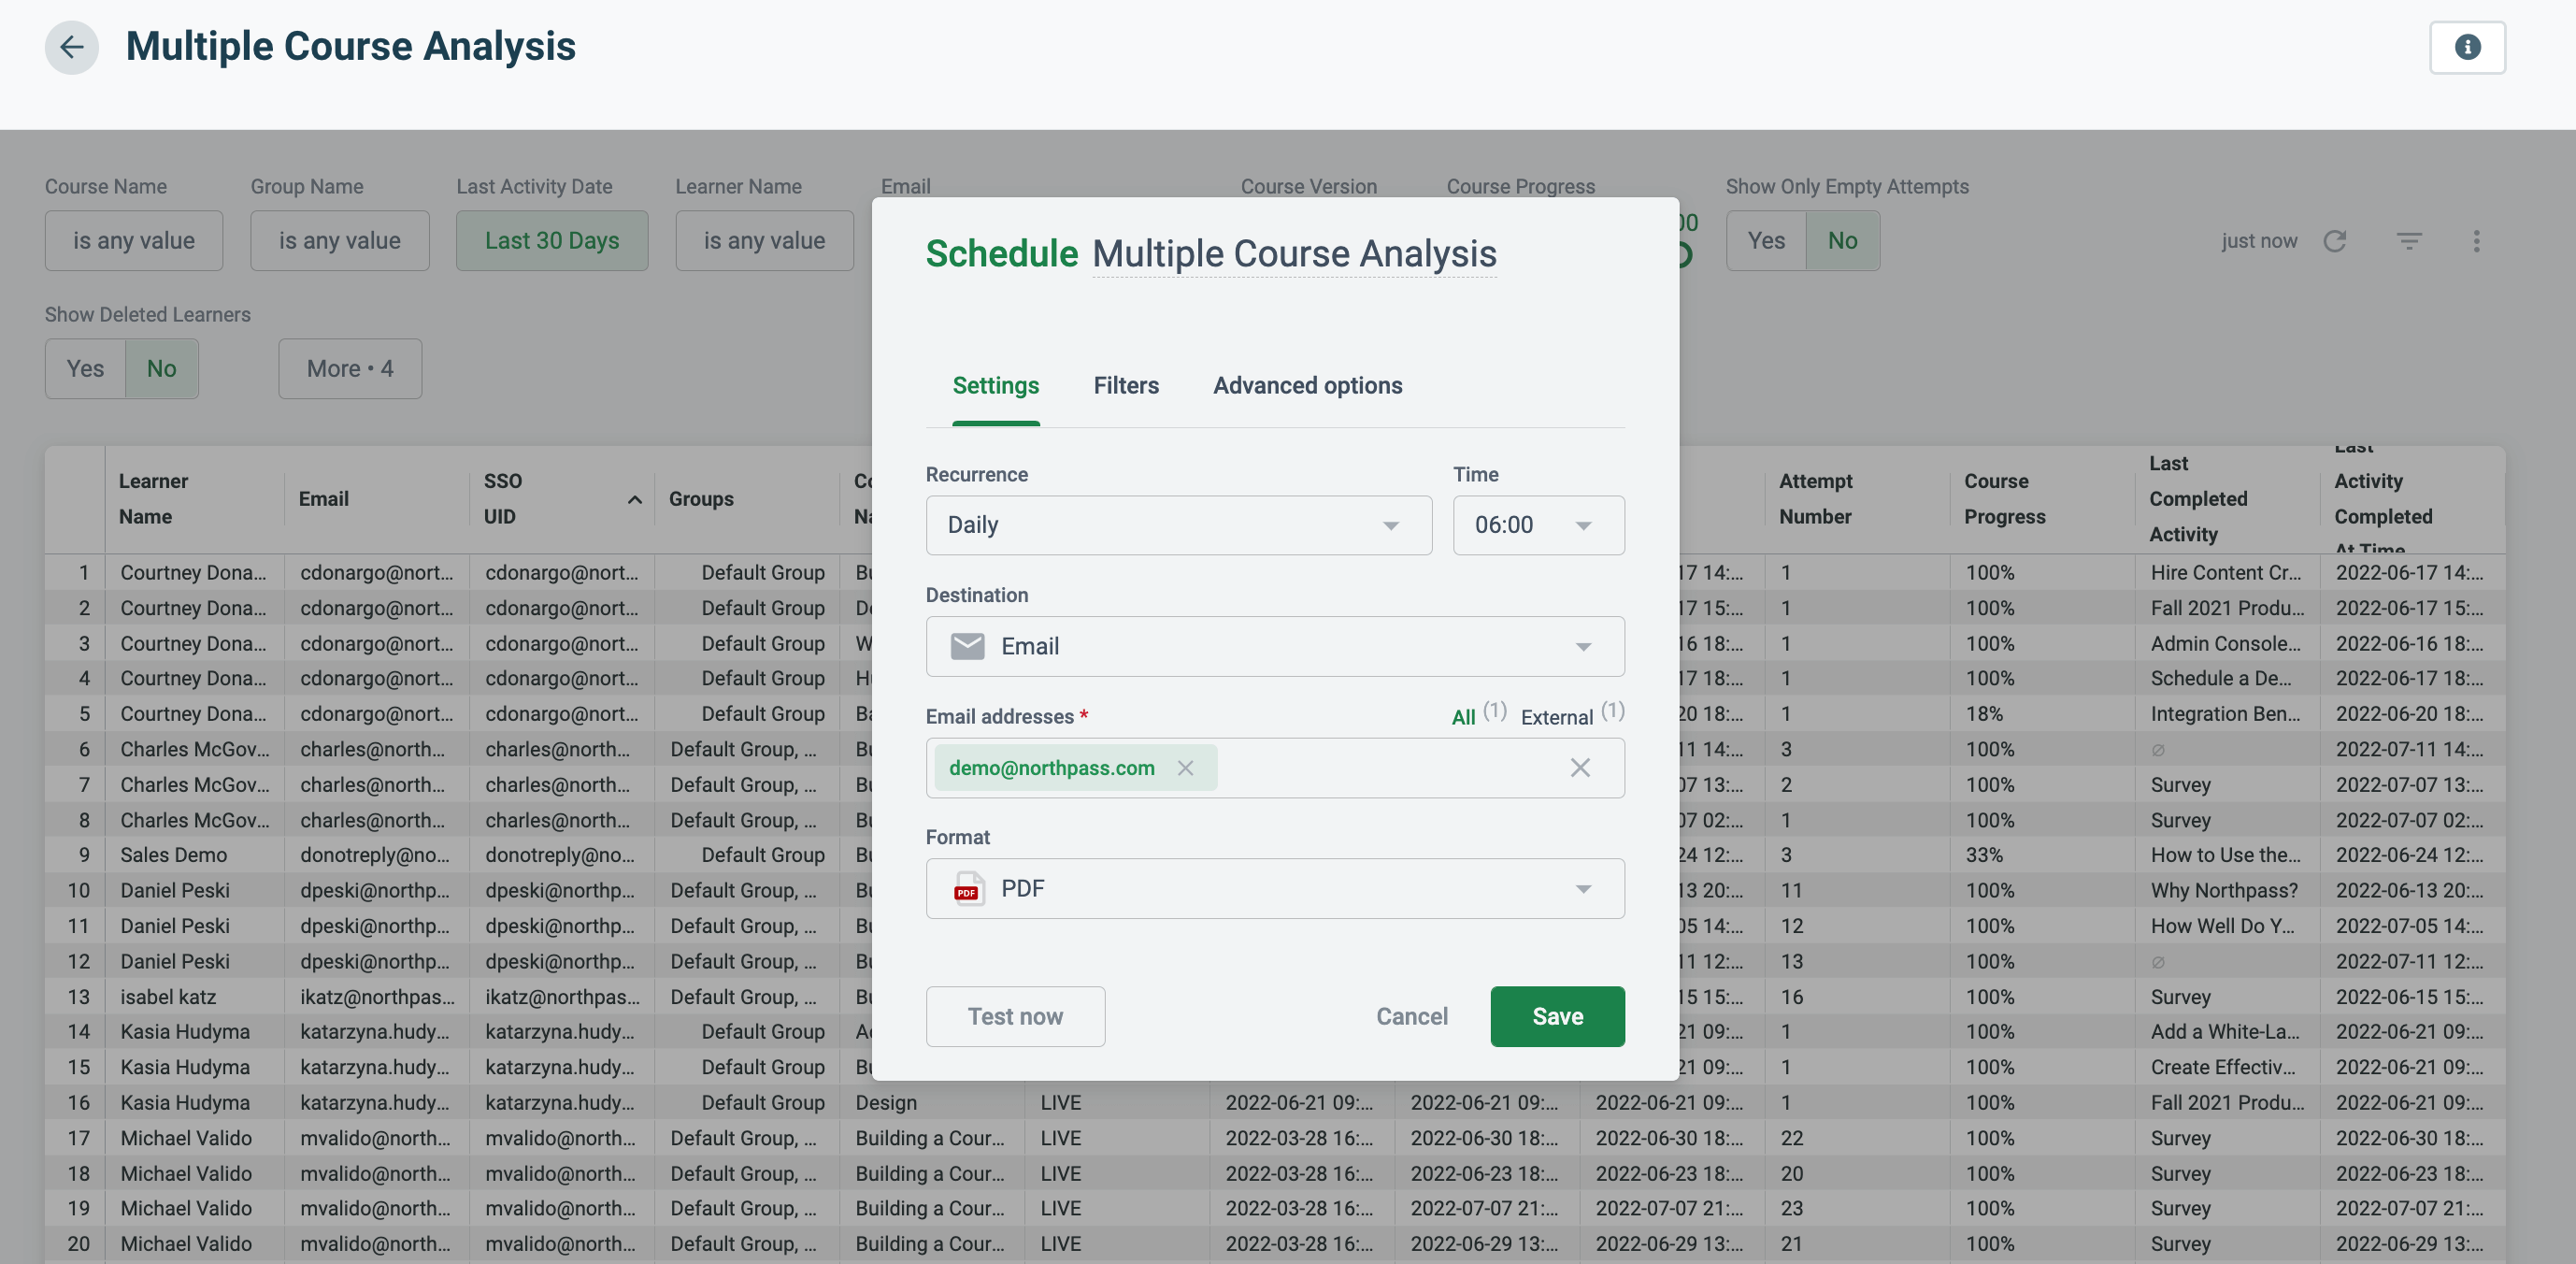
Want to brand your report before you share it with the leadership team? You can do that.
What about a scheduled report automatically delivered to your inbox every Monday? Yep, that too.
How about insights into how a subset of your customers is engaging with your academy? You bet.
Recap: What to Expect from Northpass Analytics
At Northpass, we’re evolving our technology to ensure you’re equipped with an LMS primed to deliver value to you and your learners.
Our goal is to help you achieve yours.
The new analytics suite is just the latest example of that.
Let’s recap what you expect:
- 3 all-new reports to give you never-before-seen insights into your learning program.
- Enhancements to 4 existing reports to make them more comprehensive, visual and flexible.
- A redesigned Dashboard that makes it easy for you to find the reports you need.
Why does this matter?
- A Vantage Point into ROI: With more comprehensive insights, you can correlate learning data with other internal technologies, like your CRM and Help Desk, to measure how your academy impacts your bottom line.
- Faster Optimizations: More accessible and digestible data helps you quickly identify gaps in your academy and opportunities to improve it.
- Increase Engagement: In-depth insights offer you a true POV into how people are learning and engaging with your content so that you take the necessary steps to improve, motivate and internally market your academy.
Want to see our all-new analytics experience? Reach out today.